Control Mappings
In this notebook, two different approaches to generating mappings that serve as a kind of negative controls will be used. Please make sure that you have run the Mapping notebook before executing this one.
[1]:
import nabo
Approach number one
In the first approach the target sample will be mapped onto the reference graph generated in Mapping notebook, but the target cells are prohibited from projecting onto reference cells that received a high score. To do this, we first load the graph saved at the end of Mapping notebook using the load_from_gml method. Next, we save the names of reference nodes with a high score (here we set a threshold of
1 using min_score) into a variable (high_score_ref_nodes here). Next, we instantiate a mapping object as done in Mapping notebook but do not call the make_ref_graph method. Instead we proceed directly to the map_target method. Here we provide a label MEnull to this target projection and we provide an extra parameter ignore_ref_cells with value
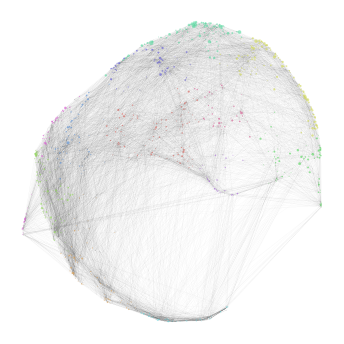
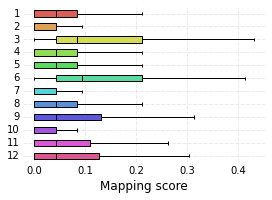
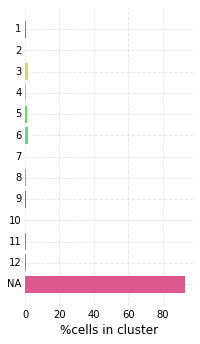
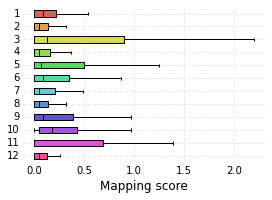
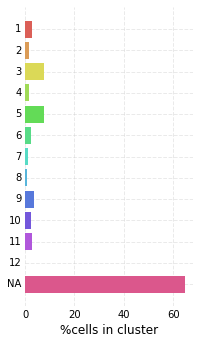
high_score_ref_nodes. This mapping is loaded into the graph, which can be visualized as before. Lastly, we plot the distribution of mapping scores for each cluster, as well as plot the number of target cells predicted from each cluster.
[2]:
hvg_graph = nabo.Graph()
hvg_graph.load_from_gml('../analysis_data/hvg_graph.gml')
high_score_ref_nodes = hvg_graph.get_mapping_score(
    'ME', min_score=1, sorted_names_only=True, remove_suffix=True)
mapping = nabo.Mapping('../analysis_data/mapping.h5', 'WT',
                       '../analysis_data/hvg_pca_WT.h5', 'data')
mapping.set_parameters(15, 11, 0.25, 500)
mapping.map_target('MEnull', '../analysis_data/hvg_pca_ME.h5',
                   'data', ignore_ref_cells=high_score_ref_nodes,
                  overwrite=True)
hvg_graph.load_from_h5('../analysis_data/mapping.h5', 'MEnull', 'target')

null_mapping_score = hvg_graph.get_mapping_score('MEnull')
nabo.GraphPlot(hvg_graph, vc_attr='cluster', vs=null_mapping_score)

me_null_cluster_scores = hvg_graph.get_mapping_score('MEnull')
nabo.plot_cluster_scores(me_null_cluster_scores, clusters=hvg_graph.clusters)
me_null_target_clusters = hvg_graph.classify_target('MEnull')
nabo.plot_target_class_counts(me_null_target_clusters, ref_values=hvg_graph.clusters, sort=False)
Approach number two
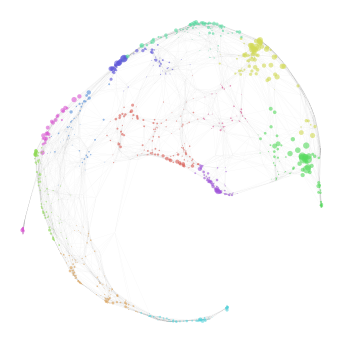
In the second approach, the mapping is performed using PCA dimensions created using low variance genes (LVG) in the Preprocessing notebook. We essentially take the same steps as we did there. We change the output filename to lvg_mapping.h5 and the name of the input reference file to lvg_pca_WT.h5. The name of the input file for MLL-ENL target sample is changed to lvg_pca_ME.h5. We keep the same parameter values as before. Note that unlike the previous
approach we do create a new reference graph here. We then create a new graph (called lvg_graph here) and load these mappings on it. We import the cluster information from hvg_graph as well as the graph layout, to allow for easy visual comparison. It should be noted that an LVG graph can have a different set of edges than a HVG graph.
[3]:
lvg_mapping = nabo.Mapping('../analysis_data/lvg_mapping.h5', 'WT',
                           '../analysis_data/lvg_pca_WT.h5', 'data')
lvg_mapping.set_parameters(15, 11, 0.25, 500)
lvg_mapping.make_ref_graph()
lvg_mapping.map_target('ME', '../analysis_data/lvg_pca_ME.h5', 'data',
                      overwrite=True)
lvg_graph = nabo.Graph()
lvg_graph.load_from_h5('../analysis_data/lvg_mapping.h5', 'WT', 'reference')
lvg_graph.load_from_h5('../analysis_data/lvg_mapping.h5', 'ME', 'target')

lvg_graph.import_clusters(hvg_graph.clusters)
lvg_graph.import_layout(hvg_graph.refG.layout)

lvg_mapping_score = lvg_graph.get_mapping_score('ME')
nabo.GraphPlot(lvg_graph, vc_attr='cluster', vs=lvg_mapping_score)

lvg_cluster_scores = lvg_graph.get_mapping_score('ME')
nabo.plot_cluster_scores(lvg_cluster_scores, clusters=lvg_graph.clusters)
lvg_target_clusters = lvg_graph.classify_target('ME')
nabo.plot_target_class_counts(lvg_target_clusters, ref_values=lvg_graph.clusters, sort=False)
lvg_graph.save_graph('../analysis_data/lvg_graph.gml')